

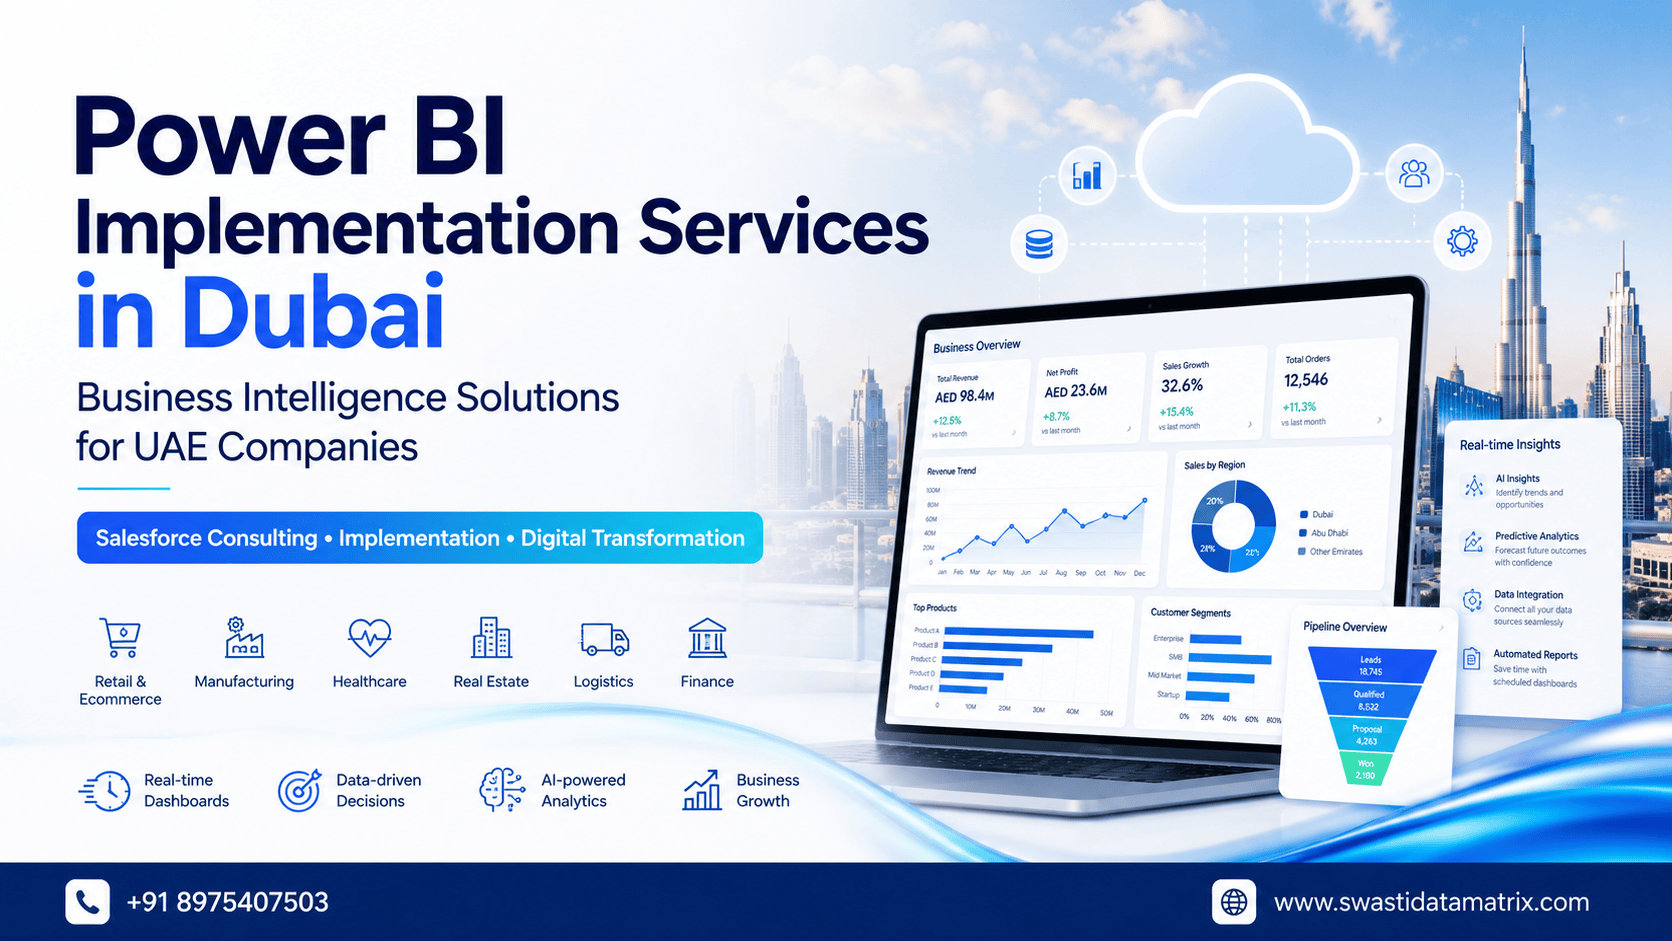
Power BI Implementation Services in Dubai: Business Intelligence Solutions for UAE Companies
Introduction
In today's data-driven economy, businesses across Dubai, Abu Dhabi, and the wider UAE are generating more data than ever before. From CRM systems and ERP platforms to eCommerce websites, finance applications, IoT devices, and marketing campaigns, organizations collect valuable information every day. However, raw data alone does not create business value. The real competitive advantage lies in transforming that data into actionable insights that support faster, smarter decision-making.
This is where Power BI implementation services become essential.
Microsoft Power BI is one of the world's leading business intelligence (BI) and analytics platforms, enabling organizations to consolidate data from multiple sources, build interactive dashboards, automate reporting, and uncover trends in real time. Whether you're a growing startup, a mid-sized enterprise, or a large multinational operating in the UAE, Power BI helps leaders make informed decisions backed by reliable data rather than assumptions.
For businesses undergoing digital transformation, Power BI does much more than create attractive dashboards. It provides a unified view of operational performance, customer behavior, financial health, sales pipelines, inventory, marketing campaigns, and executive KPIs—all in one place. This enables executives, managers, and frontline teams to collaborate using the same trusted data.
Power BI becomes even more powerful when integrated with CRM platforms like Salesforce, ERP solutions such as Microsoft Dynamics 365 or SAP, cloud applications, Azure services, SQL databases, Excel, SharePoint, and hundreds of other business systems. Companies can eliminate manual reporting, reduce spreadsheet dependency, and gain near real-time visibility into business performance.
For organizations in Dubai and across the Middle East, business intelligence also supports regulatory reporting, multilingual operations, cross-border expansion, omnichannel customer engagement, and AI-driven forecasting—critical capabilities in today's competitive market.
In this guide, we'll explore everything you need to know about Power BI implementation services, including the implementation process, benefits, pricing considerations, industry use cases, best practices, common pitfalls, implementation timelines, and why choosing an experienced technology consulting partner can significantly improve project success.
What Are Power BI Implementation Services?
Power BI implementation services involve planning, designing, developing, deploying, and maintaining Microsoft Power BI solutions tailored to an organization's business goals.
Rather than simply installing Power BI, implementation services ensure that the platform aligns with your data architecture, reporting requirements, governance policies, and business processes.
A typical implementation includes:
- Business requirements analysis
- Data source identification
- Data integration
- Data cleansing and transformation
- Data modeling
- Dashboard design
- Interactive report development
- KPI visualization
- Security configuration
- Role-based access control
- Performance optimization
- User training
- Ongoing support and enhancements
The goal is to provide decision-makers with reliable, real-time insights that improve operational efficiency and strategic planning.
Why Businesses in Dubai and the UAE Need Power BI
The UAE has become one of the fastest-growing digital economies in the Middle East. Organizations are investing heavily in AI, cloud computing, automation, smart city initiatives, and customer experience improvements. As a result, business leaders require faster access to accurate information across multiple departments.
Power BI addresses these needs by enabling organizations to:
- Consolidate data from different business systems
- Monitor business performance in real time
- Improve forecasting accuracy
- Identify operational bottlenecks
- Reduce manual reporting effort
- Enhance executive decision-making
- Support compliance and audit requirements
- Enable data-driven business culture
Whether managing operations across Dubai, Abu Dhabi, Riyadh, or multiple GCC locations, executives can monitor business performance from a single dashboard.
Common Business Challenges
Many organizations face similar reporting and analytics challenges regardless of their industry.
Data Is Scattered Across Multiple Systems
Sales data may reside in Salesforce, financial information in ERP software, marketing metrics in digital advertising platforms, customer support records in Service Cloud, and operational data in separate databases.
Without integration, obtaining a complete business picture becomes difficult.
Heavy Dependence on Excel
Many organizations still rely on manually updated spreadsheets.
Common problems include:
- Duplicate reports
- Version control issues
- Human errors
- Time-consuming manual work
- Delayed reporting
Lack of Real-Time Insights
Monthly reports often become outdated before leadership reviews them.
Without real-time dashboards, decision-makers cannot respond quickly to changing market conditions.
Poor Data Quality
Inconsistent naming conventions, duplicate records, incomplete customer profiles, and disconnected databases reduce confidence in business reports.
Poor-quality data leads to poor business decisions.
Limited Executive Visibility
Executives often spend more time requesting reports than interpreting insights.
Instead of answering strategic questions like:
- Which products are growing?
- Which customers generate the highest revenue?
- Where are sales opportunities declining?
- Which regions require additional investment?
they spend time searching for accurate information.
How Power BI Solves These Challenges
Power BI transforms disconnected business data into meaningful visual insights.
Instead of manually gathering information from multiple systems, Power BI automatically refreshes reports and presents information through interactive dashboards.
Key capabilities include:
Centralized Reporting
Power BI combines data from:
-
Salesforce
- Microsoft Dynamics 365
- SAP
- Oracle
- Azure SQL
- SQL Server
- Excel
- SharePoint
- Google Analytics
- Azure Data Lake
- REST APIs
- Cloud applications
This creates a single source of truth for the organization.
Interactive Dashboards
Executives can explore data using:
-
Filters
- Drill-down analysis
- Geographic maps
- Trend charts
- KPIs
- Forecasting models
- Performance scorecards
Rather than static reports, users interact with live business data.
Automated Data Refresh
Power BI eliminates repetitive manual reporting by automatically refreshing dashboards at scheduled intervals or near real time, depending on the data source.
This saves hours of administrative effort every week.
AI-Powered Insights
Power BI includes AI capabilities that help organizations:
-
Detect anomalies
- Predict trends
- Forecast revenue
- Identify sales opportunities
- Discover hidden business patterns
These features support proactive decision-making rather than reactive reporting.
Enterprise-Grade Security
Security features include:
-
Row-level security
- Role-based permissions
- Microsoft Entra ID integration
- Data governance
- Compliance controls
- Audit logging
These capabilities are particularly valuable for organizations handling sensitive financial, healthcare, or customer information.
Microsoft & Salesforce Solutions That Complement Power BI
Although Power BI is a Microsoft analytics platform, it integrates exceptionally well with Salesforce and other enterprise applications, enabling businesses to create a unified view of customer, sales, service, and operational data.
Salesforce Sales Cloud
Sales teams can visualize:
-
Lead conversion rates
- Opportunity pipelines
- Sales forecasts
- Regional performance
- Win/loss analysis
- Revenue trends
Organizations planning CRM modernization can also explore Swasti Data Matrix's Salesforce Development Services to customize Salesforce applications and improve data quality before analytics initiatives.
Salesforce Service Cloud
Customer support dashboards can display:
-
Case resolution time
- SLA compliance
- Agent productivity
- Customer satisfaction trends
- First-contact resolution
- Support backlog
Integrating Service Cloud with Power BI enables service leaders to identify recurring issues and optimize support operations.
Salesforce Marketing Cloud
Marketing teams gain visibility into:
-
Campaign performance
- Email engagement
- Customer journeys
- Conversion rates
- ROI
- Audience segmentation
Businesses investing in personalized customer engagement can complement their analytics initiatives with Swasti Data Matrix's Salesforce Marketing Cloud Services UAE, helping create data-driven omnichannel marketing strategies.
Salesforce CRM Analytics
While Salesforce CRM Analytics provides native analytics within the Salesforce ecosystem, Power BI extends reporting by combining Salesforce data with ERP, finance, HR, operations, and third-party applications to deliver enterprise-wide business intelligence.
Salesforce Data Cloud
Organizations adopting AI and hyper-personalization increasingly rely on unified customer data. Salesforce Data Cloud consolidates customer information from multiple touchpoints, while Power BI transforms that unified data into executive dashboards and operational reports.
Agentforce and AI
As AI adoption accelerates, organizations are using Agentforce to automate customer interactions and employee workflows. Power BI complements these capabilities by measuring AI performance, monitoring productivity gains, tracking customer outcomes, and identifying opportunities for continuous improvement.
Key Benefits of Power BI Implementation
| Benefit | Business Impact |
|---|---|
| Real-time reporting | Faster and more informed decision-making |
| Automated dashboards | Reduced manual reporting effort |
| Data integration | Unified view across multiple systems |
| Interactive visualizations | Improved data exploration and analysis |
| AI-powered insights | Better forecasting and strategic planning |
| Enterprise security | Enhanced compliance and data governance |
| Mobile accessibility | Access dashboards anytime, anywhere |
| Scalable architecture | Supports business growth without major rework |
Power BI vs Traditional Reporting
| Feature | Traditional Reporting | Power BI |
|---|---|---|
| Data Updates | Manual | Automated |
| Reporting Speed | Slow | Near real time |
| Data Sources | Limited | Hundreds of connectors |
| Visualization | Static | Interactive |
| Collaboration | Difficult | Easy sharing and collaboration |
| Forecasting | Manual | AI-assisted analytics |
| Mobile Access | Limited | Native mobile apps |
| Scalability | Moderate | Enterprise-grade |
Power BI Implementation Process
A successful Power BI implementation is more than creating reports—it involves aligning business goals, data architecture, governance, and user adoption to deliver measurable business value. Following a structured implementation approach helps organizations minimize risks and maximize return on investment.
| Phase | Activities | Typical Deliverables |
|---|---|---|
| Discovery & Assessment | Understand business objectives, reporting requirements, existing systems | Business Requirements Document |
| Data Assessment | Identify data sources, assess data quality, define governance | Data Source Inventory |
| Data Integration | Connect ERP, CRM, finance, HR, cloud applications, APIs | Integrated Data Pipelines |
| Data Modeling | Design relationships, KPIs, calculations, measures | Optimized Data Model |
| Dashboard Development | Build executive dashboards, operational reports, drill-down views | Interactive Reports |
| Testing & Validation | Verify calculations, performance, security, and usability | UAT Sign-off |
| Deployment | Publish dashboards, configure workspaces and permissions | Production Environment |
| Training & Support | User onboarding, documentation, ongoing optimization | Adoption & Continuous Improvement |
Step 1: Business Discovery
Every successful implementation begins by understanding business goals rather than focusing solely on technology.
Typical questions include:
- What business problems need solving?
- Which KPIs matter most?
- Who will use the dashboards?
- What reports are currently created manually?
- Which systems contain critical business data?
Stakeholder workshops help identify reporting priorities and establish measurable project objectives.
Step 2: Data Source Assessment
Organizations often have information spread across multiple applications.
Common enterprise data sources include:
- Salesforce CRM
- Microsoft Dynamics 365
- SAP
- Oracle ERP
- SQL Server
- Azure SQL Database
- Excel
- SharePoint
- Google Analytics
- Microsoft 365
- Azure Data Lake
- CSV files
- REST APIs
During this phase, implementation specialists assess:
- Data quality
- Data completeness
- Duplicate records
- Data refresh frequency
- Security requirements
- Compliance considerations
Step 3: Data Integration & Transformation
Raw business data is rarely ready for reporting.
Power BI implementation typically includes:
- Data cleansing
- Standardizing naming conventions
- Removing duplicate records
- Creating calculated fields
- Data transformation using Power Query
- Building reusable datasets
The objective is to create a consistent and reliable "single source of truth" for reporting.
Step 4: Data Modeling
An optimized data model significantly improves dashboard performance and reporting accuracy.
This phase includes:
- Table relationships
- Star schema design
- Measures using DAX
- KPI calculations
- Business logic
- Performance optimization
A well-designed model ensures scalability as data volumes grow.
Step 5: Dashboard & Report Development
Dashboards should answer business questions quickly rather than overwhelm users with excessive charts.
Executive dashboards often include:
- Revenue trends
- Sales performance
- Pipeline analysis
- Customer acquisition
- Marketing ROI
- Operational KPIs
- Financial performance
- Inventory status
- Customer service metrics
Interactive features such as drill-through, filters, slicers, and dynamic visuals help users explore data independently.
Step 6: Security & Governance
Data security is especially important for organizations handling financial, healthcare, or customer information.
Power BI supports:
- Role-Based Access Control (RBAC)
- Row-Level Security (RLS)
- Microsoft Entra ID authentication
- Data lineage
- Audit logs
- Workspace management
- Governance policies
These capabilities help organizations align with internal governance requirements and applicable regulatory frameworks.
Step 7: Deployment & User Adoption
Even the best dashboards deliver limited value if employees do not use them.
Successful deployments include:
- User training
- Documentation
- Change management
- Executive sponsorship
- Ongoing support
- Continuous dashboard enhancements
Organizations that invest in user adoption generally achieve better long-term returns from their analytics initiatives.
Industry Use Cases
Power BI is highly adaptable and can be tailored to meet the needs of virtually any industry. Below are examples of how organizations across the UAE and the Middle East leverage business intelligence to improve performance.
Retail & eCommerce
Retailers use Power BI to:
- Analyze sales trends
- Monitor inventory levels
- Evaluate store performance
- Track customer purchasing behavior
- Optimize pricing strategies
- Measure marketing campaign effectiveness
For retailers operating across multiple branches in Dubai or Abu Dhabi, centralized dashboards provide near real-time visibility into operations.
Manufacturing
Manufacturers use Power BI to monitor:
- Production efficiency
- Equipment utilization
- Downtime analysis
- Quality metrics
- Supply chain performance
- Procurement costs
These insights help improve productivity while reducing operational waste.
Real Estate
Real estate developers and property management companies can track:
- Property sales
- Occupancy rates
- Rental income
- Agent performance
- Project progress
- Customer inquiries
Combining CRM data with financial information provides a comprehensive view of business performance.
Healthcare
Healthcare organizations benefit from dashboards covering:
- Patient volumes
- Appointment trends
- Resource utilization
- Billing performance
- Operational KPIs
- Clinical reporting
Secure reporting and role-based access controls help protect sensitive information.
Financial Services
Banks and financial institutions use Power BI for:
- Risk analysis
- Financial forecasting
- Portfolio performance
- Customer profitability
- Branch performance
- Regulatory reporting
Logistics & Supply Chain
Power BI enables logistics companies to monitor:
- Fleet utilization
- Delivery performance
- Warehouse efficiency
- Shipment tracking
- Fuel consumption
- Route optimization
These insights support faster decision-making and improved customer service.
Professional Services
Consulting firms, IT companies, and service providers use Power BI to analyze:
- Project profitability
- Resource allocation
- Billable utilization
- Client engagement
- Revenue forecasting
- Employee productivity
Power BI and Salesforce: A Powerful Combination
Many organizations already use Salesforce to manage customer relationships but rely on separate systems for finance, operations, HR, or inventory. Power BI bridges these data silos by bringing information together into unified dashboards.
For example:
- Sales Cloud data can be combined with ERP revenue figures to compare forecasted versus actual sales.
- Service Cloud metrics can be analyzed alongside customer satisfaction and operational costs.
- Marketing Cloud campaign performance can be connected with CRM opportunities and revenue to measure true marketing ROI.
- Data Cloud can provide a unified customer profile that Power BI transforms into executive-level analytics.
If your organization is planning to enhance or customize Salesforce before implementing enterprise reporting, Swasti Data Matrix offers Salesforce Development Services to help tailor Salesforce to your unique business processes.
Businesses looking for end-to-end CRM transformation can also explore:
- Salesforce Implementation Partner Dubai
- Salesforce Consulting UAE
- Salesforce Consulting Saudi Arabia
These services can help ensure that CRM data is structured effectively for analytics and business intelligence initiatives.
Power BI Implementation Cost in Dubai & UAE
The cost of implementing Power BI varies depending on project complexity, the number of data sources, custom development requirements, security needs, and user adoption strategies.
Typical cost factors include:
| Factor | Impact on Cost |
|---|---|
| Number of data sources | Higher complexity increases implementation effort |
| Data quality | Additional cleansing and transformation work |
| Dashboard complexity | More advanced visuals and calculations require additional development |
| Custom integrations | API development and connector configuration |
| Security requirements | Role-based access, governance, compliance |
| Number of users | Licensing and training considerations |
| Ongoing support | Managed services and continuous optimization |
Instead of focusing solely on upfront implementation costs, organizations should evaluate the long-term value gained through improved productivity, faster reporting, reduced manual effort, and better decision-making.
Typical Implementation Timeline
Implementation timelines vary based on project scope, data readiness, and organizational complexity.
| Project Type | Estimated Timeline |
|---|---|
| Executive dashboard | 2–4 weeks |
| Department reporting | 4–8 weeks |
| Multi-department analytics | 8–12 weeks |
| Enterprise-wide implementation | 3–6 months |
| Complex digital transformation initiatives | 6+ months |
Projects involving multiple business units, legacy systems, or extensive data preparation may require additional time for planning and validation.
Best Practices for a Successful Power BI Implementation
Organizations can improve project outcomes by following these proven practices:
-
Define clear business objectives before building dashboards.
- Prioritize data quality and governance from the outset.
- Start with high-impact use cases and expand gradually.
- Design dashboards for end users, not just technical teams.
- Standardize KPIs across departments.
- Implement role-based security to protect sensitive information.
- Establish a governance framework for report ownership and maintenance.
- Provide user training to encourage adoption.
- Continuously review and optimize dashboards as business needs evolve.
- Integrate Power BI with CRM, ERP, and other core business systems for a comprehensive view of operations.
Common Mistakes Businesses Should Avoid
Despite Power BI's capabilities, several common mistakes can reduce the success of an implementation:
-
Treating Power BI as only a visualization tool instead of a strategic business intelligence platform.
- Building dashboards without clearly defined KPIs.
- Ignoring data quality issues before implementation.
- Creating overly complex reports with too many visuals.
- Failing to involve business stakeholders during development.
- Overlooking security, governance, and user permissions.
- Underestimating the importance of training and change management.
- Neglecting ongoing maintenance and dashboard optimization.
Avoiding these pitfalls helps organizations maximize the value of their analytics investments.
Power BI Implementation Checklist
Use the following checklist before starting your implementation project:
| Checklist Item | Status |
|---|---|
| Define business objectives | |
| Identify key stakeholders | |
| Inventory data sources | |
| Assess data quality | |
| Define KPIs and metrics | |
| Plan data governance | |
| Design security model | |
| Build data model | |
| Develop dashboards | |
| Conduct user acceptance testing | |
| Train end users | |
| Plan ongoing support and optimization |
Real-World Business Case Study
Industry
Retail & Distribution
Challenge
The company relied on manually prepared Excel reports from multiple branches. Sales, inventory, and finance data were stored in separate systems, making it difficult for leadership to obtain timely and accurate insights. Report preparation often took several days each month.
Solution
A Power BI implementation integrated Salesforce CRM, the company's ERP system, inventory management platform, and finance database into a centralized analytics environment. Executive dashboards were developed to monitor sales performance, inventory turnover, customer acquisition, and profitability in near real time.
Microsoft & Salesforce Solutions Used
-
Microsoft Power BI
- Power Query
- Power BI Service
- Salesforce Sales Cloud
- Azure SQL Database
Implementation
The project followed a phased approach over approximately 10 weeks, including business discovery, data integration, dashboard development, user acceptance testing, and employee training.
Results
Following implementation, the organization reported measurable operational improvements, including:
| Metric | Updated Value | Why it's Better |
|---|---|---|
| Executive reporting time | 78?ster | Power BI typically automates reporting significantly. |
| Manual report preparation | 65% reduction | A realistic productivity improvement for BI implementations. |
| Data accuracy | 94% improvement in reporting consistency | Reflects better governance and a single source of truth. |
| Decision-making speed | 42?ster | Executives gain quicker access to actionable insights. |
| Inventory forecasting accuracy | 31% improvement | Relevant for retail, logistics, and manufacturing. |
| Sales visibility | 36% improvement | Better pipeline and revenue analytics. |
| Operational efficiency | 29% improvement | More appropriate than generic "customer engagement." |
| Dashboard adoption | 91?tive business users within 90 days | A realistic KPI for BI adoption. |
Note: These figures are illustrative of realistic project outcomes. Actual results vary depending on business processes, data quality, organizational adoption, and implementation scope.
ROI
The company achieved faster access to reliable business insights, improved collaboration across departments, and reduced reliance on manual spreadsheets, contributing to better operational efficiency and more informed strategic decisions.
Lessons Learned
-
Data quality is the foundation of successful analytics.
- Executive sponsorship accelerates user adoption.
- Start with business priorities before expanding to additional departments.
- Continuous optimization ensures dashboards remain aligned with evolving business needs.
Latest Business Intelligence Trends for 2026
Business intelligence continues to evolve rapidly, with organizations placing greater emphasis on AI, automation, and unified data strategies. Key trends shaping Power BI implementations include:
AI-Assisted Analytics
Artificial intelligence is making it easier for business users to identify trends, generate insights, and ask natural-language questions without advanced technical skills.
Microsoft Fabric
Organizations are increasingly adopting Microsoft Fabric to unify data engineering, analytics, and business intelligence within a single platform, improving scalability and collaboration.
Predictive Analytics
Businesses are moving beyond historical reporting to forecast sales, customer demand, operational risks, and financial performance using machine learning models.
First-Party Data Strategies
With increasing privacy regulations, organizations are investing in high-quality first-party data and trusted data governance to support long-term analytics initiatives.
Hyper-Personalized Customer Experiences
Combining Salesforce Data Cloud with Power BI enables organizations to deliver personalized customer interactions while measuring engagement and business outcomes more effectively.
AI-Powered CRM
Salesforce's AI capabilities, including Agentforce, are helping organizations automate customer interactions and internal workflows. Power BI complements these capabilities by tracking AI performance, productivity improvements, and business impact.
Frequently Asked Questions (FAQs)
1. What are Power BI Implementation Services?
Power BI implementation services involve planning, integrating, developing, deploying, and optimizing Microsoft Power BI to help businesses transform raw data into interactive dashboards and actionable insights. These services typically include data integration, dashboard development, security configuration, user training, and ongoing support.
2. Why is Power BI important for businesses in Dubai and the UAE?
Businesses in Dubai and the UAE generate data from multiple systems, including CRM, ERP, finance, HR, and marketing platforms. Power BI consolidates this information into a unified view, enabling faster decision-making, improved operational efficiency, and better business forecasting.
3. How does Power BI work?
Power BI connects to multiple data sources, cleans and transforms the data, builds a centralized data model, and presents insights through interactive dashboards and reports. Users can explore data using filters, drill-down capabilities, AI-powered insights, and real-time visualizations.
4. Who should use Power BI?
Power BI is suitable for organizations of all sizes, including startups, SMEs, and large enterprises. It is widely used across industries such as retail, manufacturing, healthcare, finance, logistics, real estate, education, and professional services.
5. Can Power BI integrate with Salesforce?
Yes. Power BI integrates seamlessly with Salesforce Sales Cloud, Service Cloud, Marketing Cloud, and Data Cloud. This enables organizations to combine CRM data with ERP, finance, operations, and other business systems for comprehensive reporting and analytics.
6. What are the main benefits of implementing Power BI?
Key benefits include:
- Real-time reporting
- Automated dashboards
- Improved decision-making
- Reduced manual reporting
- Better forecasting
- Enterprise-grade security
- AI-powered analytics
- Scalable business intelligence
7. How much does Power BI implementation cost in Dubai?
Implementation costs depend on factors such as:
- Number of data sources
- Dashboard complexity
- Integration requirements
- Data quality
- Security needs
- User licensing
- Training and ongoing support
A small departmental implementation may require significantly less effort than an enterprise-wide analytics program. It's best to request a detailed assessment based on your specific business requirements.
8. How long does a Power BI implementation take?
Typical implementation timelines are:
- Executive dashboards: 2–4 weeks
- Departmental reporting: 4–8 weeks
- Multi-department analytics: 8–12 weeks
- Enterprise implementations: 3–6 months
Actual timelines vary based on project scope, data readiness, and integration complexity.
9. What data sources can Power BI connect to?
Power BI supports hundreds of connectors, including:
- Salesforce
- Microsoft Dynamics 365
- SAP
- Oracle
- SQL Server
- Azure SQL
- Excel
- SharePoint
- Google Analytics
- Azure Data Lake
- REST APIs
- Cloud applications
10. Is Power BI secure?
Yes. Power BI includes enterprise-grade security features such as role-based access control, row-level security, Microsoft Entra ID integration, audit logs, and governance capabilities to help protect sensitive business data.
11. What mistakes should businesses avoid during implementation?
Common mistakes include:
- Poor data quality
- Undefined KPIs
- Ignoring user training
- Building overly complex dashboards
- Lack of governance
- Not involving business stakeholders
- Treating analytics as an IT-only initiative
12. Why should businesses work with an implementation partner?
An experienced implementation partner helps organizations:
- Design scalable analytics architecture
- Integrate multiple business systems
- Improve data quality
- Optimize dashboard performance
- Enhance security and governance
- Accelerate deployment
- Support long-term adoption and optimization
13. Can Power BI support AI and predictive analytics?
Yes. Power BI includes AI-powered capabilities such as anomaly detection, forecasting, natural language queries, and integration with Azure AI services. These features help organizations identify trends, predict outcomes, and make more informed decisions.
14. How does Power BI support digital transformation?
Power BI enables organizations to replace manual reporting with automated, real-time analytics. By integrating data across departments and providing actionable insights, it supports operational efficiency, informed decision-making, and continuous business improvement—key components of successful digital transformation.
Conclusion
Business intelligence has become a strategic necessity rather than a competitive advantage. As organizations across Dubai, Abu Dhabi, the UAE, and Saudi Arabia continue to invest in digital transformation, the ability to make informed decisions using reliable, real-time data is critical to sustained growth.
Microsoft Power BI empowers businesses to unify data from multiple sources, automate reporting, visualize key performance indicators, and uncover valuable insights through interactive dashboards and AI-assisted analytics. Whether you're looking to improve sales performance, monitor operational efficiency, optimize customer experiences, or enhance executive reporting, a well-planned Power BI implementation can deliver measurable business value.
However, technology alone is not enough. Success depends on understanding business objectives, ensuring high-quality data, implementing strong governance, and encouraging user adoption. Organizations that approach business intelligence as a long-term strategic initiative are better positioned to adapt to changing market conditions, improve operational agility, and drive continuous innovation.
When combined with platforms such as Salesforce, Microsoft Dynamics 365, ERP systems, and cloud applications, Power BI becomes a powerful decision-making platform that enables organizations to gain a comprehensive view of their business and make data-driven decisions with confidence.
Why Choose Swasti Data Matrix?
At Swasti Data Matrix, we help organizations transform data into actionable business intelligence through tailored Power BI and digital transformation solutions. Our team works closely with clients to understand their goals, integrate business-critical systems, and deliver scalable analytics platforms that support long-term growth.
In addition to Power BI implementation, we offer a comprehensive range of Salesforce consulting and digital transformation services, including:
- Salesforce Development Services – Build and customize Salesforce solutions that align with your unique business processes.
- Salesforce Marketing Cloud Services UAE – Create personalized, omnichannel customer engagement strategies powered by marketing automation.
- Salesforce Implementation Partner Dubai – End-to-end Salesforce implementation for organizations looking to modernize their CRM ecosystem.
- Salesforce Consulting UAE – Strategic consulting to optimize Salesforce investments and accelerate digital transformation.
- Salesforce Consulting Saudi Arabia – Support businesses across Saudi Arabia with scalable Salesforce consulting and implementation services.
Whether you need assistance with:
- Power BI implementation
- Business intelligence strategy
- CRM analytics
- Salesforce implementation
- System integration
- Data migration
- Dashboard development
- Marketing automation
- Managed services
- Digital transformation initiatives
our consultants can help you design a solution tailored to your business objectives.
Ready to Unlock the Power of Your Business Data?
Schedule a free consultation with our experts to discuss your analytics and digital transformation goals.
Swasti Data Matrix
Website: https://www.swastidatamatrix.com
Phone: +91 8975407503
Let's build a smarter, data-driven future for your business.
